Has the 17-Year Cycle Bottomed?
12/11/2016 - An ongoing theme
of Cowan's books is that the stock market is built of geometric
structures. The sides of which align with 17-year cycles. Cowan showed
these structures extensively in his first books
Four-Dimensional Stock
Market Structures and Cycles. In 2009 he published his final
book Pentagonal
Time Cycle Theory where he forecast late 2016 as the
beginning date of the new 17-year cycle. He made this forecast 7 years
before the fact.
Now that 2016 is coming to a close and the market has been rocketing
higher, it's reasonable to ask if the huge 17-year cycle that started in
2000 has turned into a new cycle.
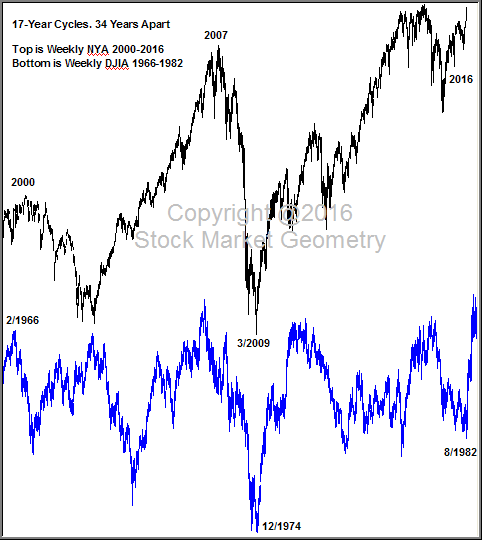
Readers of Cowan's books are familiar with the below chart showing the
17-year down cycle in the DJIA 1966-1982. Overlaid on this chart is the
most recent cycle in the NYA.
One of the first things that stands out on this chart is how the NYA
continued to make higher bottoms after 2009. The question is how can a
major 17-year cycle bottom after a 7-year series of higher bottoms. A
review of past 17-year cycles shows that this is actually the most
common way the cycle bottoms. In almost every case the mid-cycle panic
bottoms (such as the 1907, 1942, 1974 and 2009 bottoms) marked the low
price for the entire cycle.

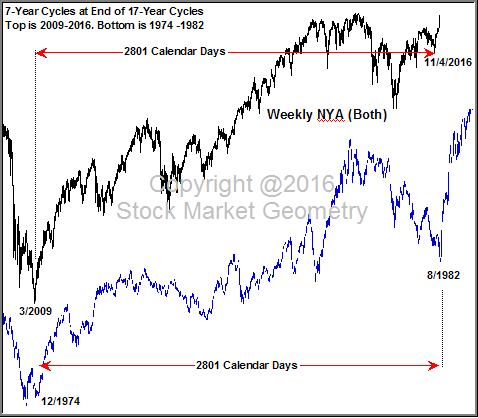
The below chart overlays the final 7 years of the 1966-1982 cycle with
the most recent 7 years in the NYA. Notice how both charts continued to
make higher bottoms off the mid-cycle panic low. The number of calendar
days in the 1974-1982 cycle exactly matches the interval from 2009 to
the most recent bottom. Traders expecting a major panic sell-off into
the 17-year cycle bottom have not reviewed how previous cycles bottomed.
The conclusion is that the stock market may now be entering a major
17-year bull cycle, the magnitude of which will surprise many traders.
Superimposed on this 17-year bull cycle is another phenomenon Cowan
wrote about, the "Periodicity of American War". Since the Revolutionary
War in 1776 American has experienced a "major" war every 84 years:
1776 + 84 = 1860 (Civil War)
1860 + 84 = 1944 (World War II)
1944 + 84 = 2028 (?)


![]()