|
|


The following article was written by Mr. Cowan and published in Tradersworld Magazine in the Spring 2003 Issue #35.

Cowan Astro Cycles Provide A
New Approach To An Old ScienceIf you have ever been curious about how planetary cycles can be used to forecast market trends, but gave up after looking at the astrology books, you are not alone. All those strange symbols and terminology like orbs, houses, rulerships, and transits can be very intimidating. And most people do not want to spend years getting a PhD in Astrology to find a reliable indicator of trend duration. Like most traders using astro techniques, I started with the classical approach, but soon discovered that by applying a few simple rules you can forecast the timing of market turns quite accurately without needing to know all the details of astrology textbooks.
Simply stated, all you need to do is follow a 3-step process:
Find a clearly identifiable top or bottom on a chart.
Find locations of planets on that date. (Software does this for you).
Make time projections by adding multiples of 30 degrees to locations in (2). (Software does this for you)
Where this technique differs from classical Astrology is that I do not care what the angles between the planets are at the tops or bottoms, just the distance they travel between two turning points. Classical Astrology tells us to expect changes when two planets are at certain predefined angles of separation. Traditionally, these are 30, 45, 60, 90, 120, and 180 degrees. But it seemed a bit arrogant to me to be telling God that he should do something on our schedule. So I looked instead at what the market was telling us, at where the planets are at the tops and bottoms and use THAT angle as the starting point, regardless of its value. It’s really a simple process that I have successfully applied to my trading for more than 20 years.
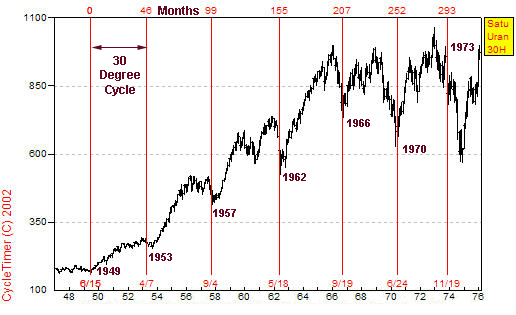
As an example, we will look at a compressed monthly chart of the DJIA from 1949 to 1975, shown below in Figure 1.
Figure 1. 30-degree heliocentric movement of Saturn relative to Uranus in the DJIA
Applying the 3-step process:Step 1 – Find a major bottom or top.
Anytime after 1950 the bottom in 1949 would have been easy to identify as a major bottom, so that will be used as our starting point.
Step 2 – Find the locations of the planets at the date in Step 1 (1949).
A book called an ephemeris can be used to find the locations of the planets, or there are several software programs that will do the same much faster. All calculations, projections, and charts in this article were made using the software CycleTimer.
Because this is a long-term monthly chart, the major cycles will correspond with the 3 slower moving outer planets Jupiter, Saturn, and Uranus. If we were working with a daily chart then the faster inner planets, Mars, Venus, Mercury would be used.
Experience has taught that most markets have a strong cycle closely correlated with the heliocentric (viewed from the sun) movement of Saturn relative to Uranus. CycleTimer shows that at the bottom in 1949 the location of Saturn was 66 degrees from Uranus, so that is the cycle origin from which our future cycle dates are projected.
Step 3 – Add 30, 60, etc degrees to the location in Step 2 (66 degrees).
Adding 30-degree increments to 66 produces 96, 126, 156, etc. CycleTimer calculates and plots in Figure 1 the dates that Saturn and Uranus were separated by these angles. Six instances of this cycle are shown, or a full 180 degrees. You can see that this cycle closely corresponded with major bottoms at every instance. Classical Astrological techniques do not identify this cycle because it does not coincide with their predefined angles of 60, 90, 120, and 150 degrees.
To improve the probability that your cycles projected into the future are accurate, be sure that at least three instances have occurred in your historical data, not including the starting point. If you have less than three occurrences of the cycle move your starting point back in time until you have at least three. And more importantly, be sure that you have no more than one or two “false positives”, that is, a cycle that arrives with no significant trend change. If you follow these rules you will have a high probability that your projected cycle dates will be correct and you can expect a reversal of trend very near that date
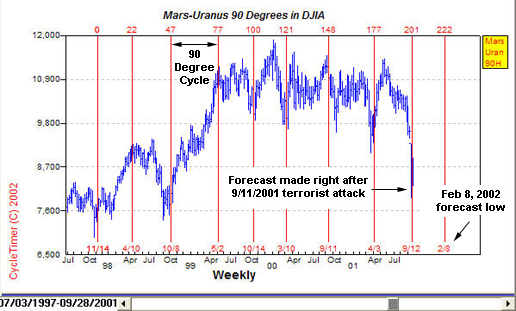
Figure 2 shows an example of how I used this 3-step technique to make a real-time forecast in October 2001 for a trend reversal in February 8. Part A is a copy of the chart I posted on the discussion group at HarmonicTiming.com in October 2001 and is available in their archives. Part B shows how the forecast turned out.
This cycle uses heliocentric 90-degree movements of Mars relative to Uranus. Following the 3-step process and using a cycle start date at the low of November 1997, produces a cycle where all eight recurrences coincided with significant market turns. Therefore, there was a high probability that the next recurrence in the future would also mark a turn.
Figure 2a. 90-degree heliocentric movement of Mars relative to Uranus used to forecast cycle low in DJIA
Figure 2.B shows what happened. On February 8 the DJIA bottomed and began an advance of 1100 points, or 11%, in one month. This is another cycle that classical Astrologers would have missed because the angles between Mars and Uranus for this cycle are 7, 83, 173 degrees, which are not any of the classical predetermined angles.
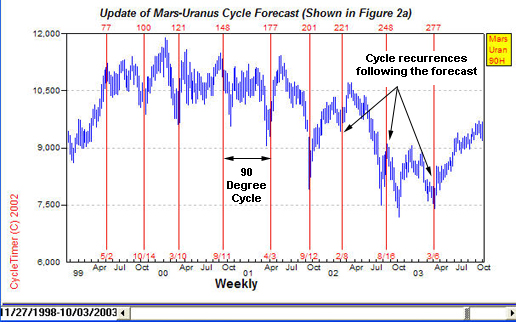
Figure 2b. Cycles arriving after the forecast was made were highly accurate. Cycle dates were automatically generated by CycleTimer software.
Nesting Cycles Amplify Their Net Effect When you gain more experience using this technique you will be able to watch more than one cycle at a time, which makes sense because there are more than two planets in the Solar System. These multiple cycles can either interfere with each other if they arrive at different times, or reinforce each other if they arrive at the same time. If two or more cycles bottom closely together (nest) they reinforce each other and their net effect is amplified. This results in a sharp panicky sell off followed by a quick recovery producing a “V” or “trauma” bottom.
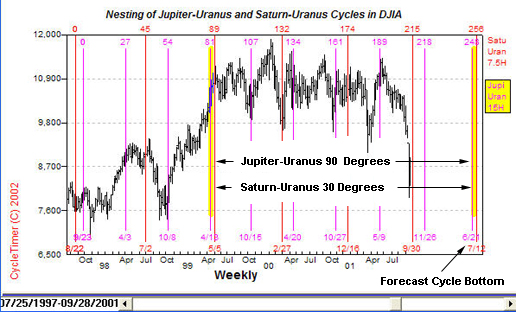
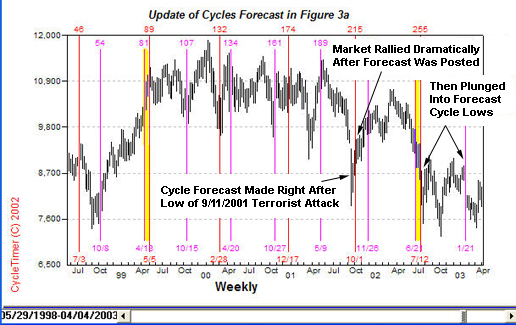
Figure 3 shows how I used the technique of nesting cycles to accurately forecast almost one year in advance the June-July 2002 sell off and bottom in stocks. This chart was also posted in the discussion group at HarmonicTiming.com in October 2001 and is available in their archives.
Figure 3a. Two cycles arriving simultaneously allowed this forecast to be accurately made one year in advance.
To keep the technique simple the cycle start dates were taken out of the textbook Four-Dimensional Stock Market Structures And Cycles and extrapolated into the future using CycleTimer software. The entire projection process took less than one minute.The Saturn-Uranus cycle we studied earlier during the 1949-1975 period is again used with the origin set at the major low of November 1994. The second cycle is another that has historically produced reliable results, the movement of Jupiter relative to Uranus, or the Jupiter-Uranus cycle. The crash low of October 1987 was used for the origin of the Jupiter-Uranus cycle because it has produced a cycle that has repeated dependably for the last 15 years.
When CycleTimer projected these two cycles into the future it showed them nesting (arriving at the same time) in late June-July producing a warning that this was a very high-risk time. The position trader would liquidate any remaining long positions he had before this high-risk time arrived and wait out the storm. So while many traders were panicking during the June-July sell off and wondering where the bottom was, my confidence in the cycle locations allowed me to enjoy a two-month island hopping vacation in Indonesia, Thailand, and Cambodia, scuba diving and studying the ancient temples, as my profits accrued.
Figure 3b. This chart updates the DJIA data after the forecast shown in Figure 3a. CycleTimer accurately forecast the panic selling in July, 2002 and January.
Works For Daytrading Too Daytraders can use the same 3-step technique on intraday data. The major difference between intraday timing and end-of-day is that intraday uses the rotation of the Earth instead of the orbits of the planets. This increases the complexity a little bit because you not only want to watch the smaller cycles but the larger ones as well. A few small cycles arriving intraday will not affect the market much if it is in a strong trend caused by a large cycle. So work with the larger cycles first before moving into intraday.
Suggested Reading
Pentagonal Time Cycle Theory
Four-Dimensional Stock Market Structures and Cycles
Market Science - Volume I - Square of Twelve
Market Science - Volume II - Market Dynamics
Software Used For Charts And Calculations
Course-Part I | Course-Part II | Gann Courses | Long-Term Data | Catalog
Place Order | About the Author | Market Calls | Testimonials | Home
Copyright© 2015 Stock Market Geometry. All Rights Reserved