Table of Contents
1 - THE 17-YEAR STOCK
MARKET CYCLE....
7
REVIEW OF THE 17-YEAR CYCLE
1792-1914.... 7
REVIEW OF THE 17-YEAR CYCLE
1914-2017.... 8
INVESTMENT STRATEGIES MUST BE
ADJUSTED FOR 17-YEAR CYCLES..... 10
2 - THE GOLDEN TRIANGLE,
TRIPLE TRIANGLE, AND SQUARE OF TWELVE.....13
THE GOLDEN TRIANGLE..... 13
3 - THE URANUS PENTAGRAM.....
17
URANUS..... 17
THE URANUS TRIPLE
TRIANGLE..... 18
POSSIBLE ORIGIN OF THE URANUS
PENTAGRAM..... 22
TIME CYCLE TRIANGULATION.....
23
4 -
Mid-Cycle Panics And
The Law Of Alternation.....
27
MID-CYCLE PANICS AND
ALTERNATING URANUS PENTAGRAMS... 29
THE MID-CYCLE PANIC OF
1973-1974..... 29
THE MID-CYCLE PANIC OF
2007-2009..... 33
PEARL HARBOR AND THE PANIC OF
1981..... 35
THE KOREAN WAR AND THE
1906-1907 "RICH MAN'S PANIC"...... 37
CONCLUSION..... 38
5-
Mid-Cycle Bottoms And
The Law Of AlternatioN.....
41
THE 1924 ACCELERATION
BOTTOM...... 41
THE 1958 ACCELERATION
BOTTOM...... 41
THE 1988 AND 1994 ACCELERATION
BOTTOMS...... 41
6 - Uranus 18 DEGREE Harmonics In The DJIA 1897 – 2007......
47
URANUS 18 DEGREE
HARMONICS BETWEEN 1998-2012..... 47
URANUS 18 DEGREE
HARMONICS BETWEEN 1980-1995..... 49
URANUS 18 DEGREE
HARMONICS BETWEEN 1966-1981..... 49
URANUS 18 DEGREE
HARMONICS BETWEEN 1950-1962..... 50
URANUS 18 DEGREE
HARMONICS BETWEEN 1937-1950..... 51
URANUS 18 DEGREE
HARMONICS BETWEEN 1897-1933..... 52
7 -
Wheels Within Wheels.....
53
SATURN-URANUS HARMONY..... 53
SATURN-URANUS SYNODIC
CLOCK..... 53
ELLIPTICAL ORBITS CAUSE
SYNODIC CYCLES TO VARY..... 55
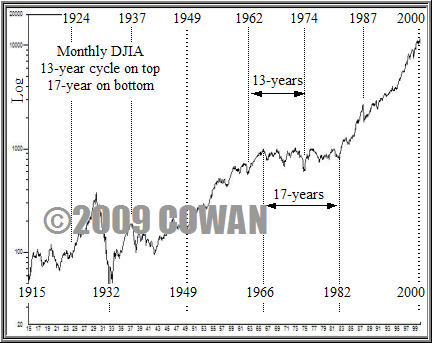
SATURN-URANUS AND THE 17-YEAR
CYCLE...... 55
SYNCHRONIZING SATURN-URANUS
WITH THE URANUS PENTAGRAM..58
TIMING THE
2000-2017 CYCLE WITH SATURN-URANUS .... 61
TIMING THE 1966-1982 CYCLE
WITH SATURN-URANUS..... 64
SATURN-URANUS MOVEMENT BETWEEN
FOUR 17-YEAR CYCLES..... 67
REAL-TIME EXAMPLE OF TRADING
THE SATURN-URANUS CYCLE.... 67
THE SATURN WHEEL..... 72
THE SATURN GOLDEN
TRIANGLE..... 80
THE SATURN
PENTAGRAM 1897-1982..... 82
SATURN 36
DEGREE
HARMONICS..... 82
8 -
Fibonacci
13–8–5 Year Cycles.....
85
THE 13-YEAR
CYCLE..... 85
50-YEAR PERIOD OF "JUBILEE"..... 86
THE URANUS PENTAGRAM AND THE
13-YEAR CYCLE..... 91
THE "MARK OF THE BEAST" CYCLE
OF 666 WEEKS..... 93
PENTAGONAL EARTH-VENUS
CYCLES..... 95
FIRST AND SECOND-ORDER
EARTH-VENUS CONJUNCTIONS..... 95
FIRST AND SECOND-ORDER
EARTH-VENUS RECURRENCE CYCLES..... 98
THE FOURTH SQUARE OF TWELVE
AND THE EARTH-VENUS CYCLE.... 101
APPLICATIONS OF EARTH-VENUS
CYCLES IN THE STOCK MARKET..... 102
FIBONACCI PARTITIONING 13-YEAR
CYCLE INTO 8 AND 5 YEARS..... 107
GANN'S 5-YEAR 2-1-2
PATTERN..... 108
9 - THE GREAT PENTAGRAM............
115
BIRTH OF THE NYSE AT THE
BUTTONWOOD AGREEMENT ..... 116
ADDING MARS TO THE 666-WEEK
BEAST CYCLE.... 117
THE CAUSE OF THE CRASH OF
1962..... 118
THE CAUSE OF THE CRASH OF
1974..... 119
THE CAUSE OF THE CRASH OF
1987..... 120
TRIPLE TRIANGLE OF 1962, 1974,
1987..... 121
THE MATHEMATICAL BASIS OF THE
666-WEEK BEAST CYCLE..... 122
INTEGRAL MULTIPLES OF 144
DEGREES
ALIGN ORBITS WITH BEAST CYCLE..123
THE PANIC OF 1984......... 126
MORE CYCLES THAT WERE USED TO
CALL THE MARCH 2009 BOTTOM.... 127
GRAND CONJUNCTION OF 1897......
130
1914 START OF WORLD WAR I
...... 131
GREAT DEPRESSION OF THE
1930s..... 132
TRIPLE TRIANGLE OF 1897, 1915,
1933...... 133
EARTH-VENUS & SATURN-URANUS
PENTAGONAL FRACTAL PATTERN..... 134
10 - RECURRING MARKET
PATTERNS.....
137
EXPANDING PENTAGONAL ENERGY
LEVELS...... 137
PENTAGONAL EXPANSION OF URANUS
TO EQUINOX PRECESSION CYCLE...138
EARTH-VENUS IS A PENTAGONAL
TIME FRACTAL OF SATURN-URANUS..... 139
PENTAGONAL EXPANSION OF VENUS
TO THE 666-WEEK BEAST CYCLE..... 140
PENTAGONAL DECOMPOSITION IN
THE ANCIENT TEMPLE OSIRION..... 140
SAROS CYCLE..... 141
THREE-DIMENSIONAL PERSPECTIVE
OF PENTAGONAL CYCLES..... 144
EXAMPLE OF EXPANDING
PENTAGRAMS AT HIGHER ENERGY LEVELS..... 145
FORECASTING TIME INTERVALS
BETWEEN REPEATING PATTERNS..... 145
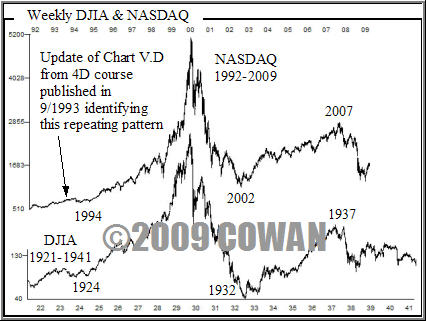
THE 1924-1939 MARKET PATTERN
REPEATED IN 1994-2009..... 148
THE 1859-1886 MARKET PATTERN
REPEATED IN 1924-1951..... 151
THE 1897-1915 MARKET PATTERN
REPEATED IN 1964-1983..... 153
URANUS PENTAGONAL EXPANSION
BETWEEN REPEATING PATTERNS..... 156
MARKET SYMMETRY OFTEN CAUSES
INVERTED PATTERNS TO MATCH..... 157
11
– COMMENTARY -
COGAN'S
Rhythmic Cycles of
Optimism and Pessimism.....
161
COGAN'S 17-YEAR STOCK MARKET
PERIODICITY..... 161
EXAMPLES OF COGAN'S 17-YEAR
PERIODICITY..... 162
CREATING A 10-CYCLE COMPOSITE
WITHOUT USING A COMPUTER.... 164
INCORPORATING Δ SATURN=180
DEGREES
INTO COGAN'S MODEL.... 168
TIMING THE FIRST FIVE YEARS
WITH Δ SATURN=60 DEGREES AND GANN..... 168
INCORPORATING Δ SATURN=36
AND 60 DEGREES INTO COGAN'S MODEL..... 170
TIMING MID-CYCLE BOTTOMS WITH
Δ SATURN=120 DEGREES..... 172
EXAMPLE OF THE 17-YEAR MODEL
IN THE NEGATIVE PHASE.....174
ALIGNING COGAN'S MODEL WITH Δ
SATURN=36 and Δ SATURN=60..... 177
LOCATION OF THE 17-YEAR CYCLE
AFTER 2000..... 177
PRICE AND PLANETARY
DISPLACEMENT SQUARES..... 180
CONCLUSION.....
181
Appendix
A - Rhythmic Cycles of
Optimism and Pessimism - Retyped.....
185
B - Rhythmic Cycles of Optimism and Pessimism -
Original.....
223
C - DIVINE PROPORTION, PENTAGRAM STAR &
GOLDEN TRIANGLE...247
D - SQUARE OF TWELVE – W.D.
GANN MASTER COURSE.....253
E - STOCK
MARKET NATURAL GROWTH EQUATION.....
257
F - PLANETARY ANGLES
BETWEEN DATES.....
261
G - Ф3
PENTAGONAL EXPANSION OF PLANETARY CYCLES.....
263
H - BOROBUDUR, JAVA AND
THE SQUARE OF TWELVE.....
265
I - URANUS
QUARTER-CYCLE STOCK MARKET UPDATE.....
269
J - URANUS TRINE. SOYBEAN
CYCLE UPDATE.....
273
K - REPRINT OF COWAN'S 2003 MAGAZINE ARTICLE.....
275
[Place
Order] 280
pages $144 (Hard Copy); $119
(E-Book)