|
|


Market Science - Volume I
Square of Twelve
Available as Full Color eBook
This is the third book in the course and continues the material presented in Four-Dimensional Stock Market Structures And Cycles by applying non-linear techniques and extending them to commodities markets. The material in these books is designed to demonstrate unique and accurate market modeling techniques that have never before been made available to the public.
"Numbered squares" is a term familiar to many market traders. These numbers are used to project the progression of financial market growth spirals, consequently defining the extent and duration of price movements. One of the most important numbered squares is the square of twelve, 144. Market Science - Volume I - Square Of Twelve shows how to identify and use the square of twelve in the soybean market. After reading this work, it will be clear why W. D. Gann wrote in his Master Courses, "The MASTER CHART is the square of 12."
The two lessons in Square Of Twelve are:
Lesson XI - Square of Twelve
Readers familiar with Lesson I of Four-Dimensional Stock Market Structures And Cycles are aware that the stock market moves within the confines of a fundamental unit of measurement.
Market Science - Square Of Twelve clearly shows that the elemental building block of the soybean market is defined by the square of twelve. Proof is provided with a detailed analysis of this market, since data was first recorded in 1913.
Lesson XII - Vectorial Partitioning
This lesson shows that applications of Isaac Newton's First Law Of Motion, also known as "Galileo's Law Of Inertia," extend to financial markets where price-time movements can be considered points of force in motion.
Just a few of the topics addressed in this book include: use of the horizontal (price) and vertical (time) angles and how the "Price-Time Radius VectorTM (PTVTM)" defines their location, how price-time measurements made in the early stages of a growth spiral define the extent of movements decades later, how to use different data sources and time units to simultaneously arrive at an indication of trend change, celestial correlations with the square of twelve, ten clear signals the soybean market gave in 5/1994 that a major top had just been hit (the drop after this top was the largest in five years).
Chart 1.A below shows why Volume II of this series is so important. It is in that work that this long-term cycle is revealed. This cycle was discovered in the soybean market by using the techniques disclosed in Four-Dimensional Stock Market Structures And Cycles, proving that the same techniques apply to all markets.
There is a clear and easy to understand natural cause for this cycle, which is explained in Volume II. The predictability of this cycle has been very reliable. It defined the tops in 1920, 1948, 1973 and the bottoms in 1932, 1961, 1986.Volume II forecast in 1995 that this cycle would again return in the year 2001, which it did marking a major bottom. Chart 1.B shows the price spikes after 2001 were the largest since the 1970's.
CHART 1.A - LONG-TERM CYCLE CASH SOYBEANS (1913-1994)
CHART 1.B - FORECAST 2001 CYCLE WAS A MAJOR BOTTOM
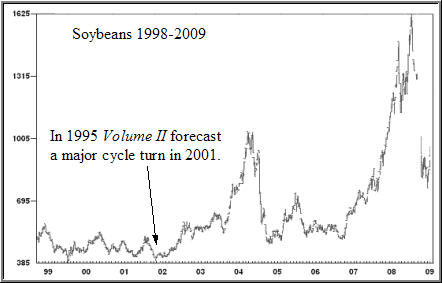
Chart 2 is an intermediate-term cycle that was discovered by the author and explained in Volume II. This is the daily cash close since the major bottom in October 1989. The author's techniques pinpointed each of the indicated turning points using a correlation with a naturally occurring phenomenon. You can see for yourself how valuable knowledge of this cycle is. This cycle is one of the many reasons that trader's studying this material would have known that 5/24/1994 was a major top before the ensuing decline set in (it dropped $2.20 per bushel in five months).
CHART 2 - INTERMEDIATE CYCLE IN CASH SOYBEANS (1989 - 1995)
Notice that the time intervals from bottom-to-bottom and from top-to-top are not constant. Sometimes it is two years and sometimes it is less. Without knowledge of the underlying natural cause, it is impossible to pinpoint this cycle. After mastery of this material the trader will not have any doubts when this cycle is due to arrive again.
Proof of this cycle is provided by showing its natural underlying cause and the turning points associated with it for a time period of more than ten years. This cycle will continue to repeat predictably in the future. You need to know the location of this cycle if you do not want to be caught unprepared.
These are only two of the cycles revealed in Market Science. The others are also extremely important. ONLY READERS OF THIS MATERIAL KNOW THE LOCATIONS OF THESE CYCLES AND WHEN THE NEXT MAJOR MOVE WILL OCCUR!
[ Return | Volume II - Market Dynamics ]
Course-Part I | Course-Part II | Gann Courses | Long-Term Data | Catalog
Place Order | About the Author | Market Calls | Testimonials | Home
Copyright© 2015 Stock Market Geometry. All Rights Reserved