|
|


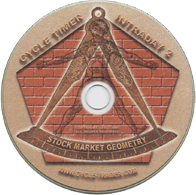
Unique Cycle Analysis Software, Courses, and Rare Data.
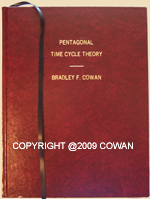
Discovered and written by award-winning author and professional trader, Bradley F. Cowan
"One of the Finest Market Analysts in History", with ~40 years trading experience.This website is the ONLY legal source for Cowan's books and software.
Instructional YouTube Videos. Subscribe there to be notified if new videos are posted.
WD Gann Diagonal Angles Scaled Correctly - Shows how to scale time for price-time balancing. 9/30/2023
Planetary and Moon Nodes and Apsides in S&P 500 - CycleTimer software is used for cycle analysis. 3/18/2023
WD Gann - Price by Degree - Mean of Five, Cycle of Eight, Correct Scaling - 12/17/2022
Pythagorean Theorem to Forecast Market Cycles - Cowan's Price-Time Vector. Correct Scaling Gann Angles - 9/5/2022
Ellipse in New York Composite - 7/31/2022
Soybeans - Wheat Astro Cycles - 7/17/2022
Cycles of War - A Dangerous Time is Approaching - 6/12/2022
Saturn-Uranus Cycle in Contemporary SP500 - 4/27/2022 - Harmonics of this astro cycle in CycleTimer.
Ellipse in Contemporary Russell 2000 - 4/23/2022 - CycleTimer applications of the George Beyer ellipse model.
Lunar Cycles in the Stock Market - 4/15/2022 - Shows how CycleTimer was used to call the 3/30/2022 top.Review 30+ Years of Cowan's Real-Time Posts Using CycleTimer Software
|
Non-Traditional Technical
Analysis
WD Gann Master
|
|
|
Four-Dimensional
Stock Market
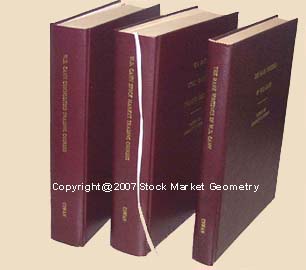
Technical Analysis of Stock and Commodities Magazine
surveyed 60,000+ subscribers for their favorite "Stock Trading
System". Cowan's books received the "Readers Choice Award".
The market modeling
techniques taught in this home-study course show how successful traders have predicted the
direction of price-time action of STOCK, FOREX, and
COMMODITIES markets
years into the future.
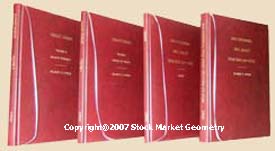
The workbook-like questions and answers show that the results obtained by applying
these techniques have an accuracy that does not err by more than one percent! For example,
if the techniques indicate a major top 100 trading days in the future the results are not
off by more than one trading day! |


 "Nature tends to synchronize elements
that initially appear to be disharmonious. At times, achieving this
synchronous state requires maximum entropy until a common denominator is
obtained, after which, stability occurs." ... p98
"Nature tends to synchronize elements
that initially appear to be disharmonious. At times, achieving this
synchronous state requires maximum entropy until a common denominator is
obtained, after which, stability occurs." ... p98 Through
a very unique combination of geometry and cycles, traders can pinpoint
turning points in both price and time days or years before they happen.
Through
a very unique combination of geometry and cycles, traders can pinpoint
turning points in both price and time days or years before they happen.