Tick ...Tock ... The Cosmic Clock
The Approaching July 2017 Alignment of the Major Planets
May 20, 2017
This
article is based on the books by Bradley F. Cowan
and some of his unpublished manuscripts on market symmetry.
It is provided as an academic study and is not intended to be used as
a market advisory service.
Correction: Some graphs below show the Saturn-Uranus cycle date as
7/11/2017. It is 7/18/2017.
In his first book, Four-Dimensional Stock Market Structures and
Cycles, Cowan wrote that the 3 major planets: Jupiter, Saturn, and
Uranus define the major stock market trends. These trends can continue
for years until they are disrupted when the major planets align along
300 axes. The biggest alignments, and biggest market trend
reversals, are along 450, 900, 1200,
1800 axes.
Mars influences the "orb of influence" of the major
planets, which provides a trigger for timing the turn on a
daily chart. Notable trend reversals have historically occurred
when all 3 major planets align on a major axis at the same time with
Mars.
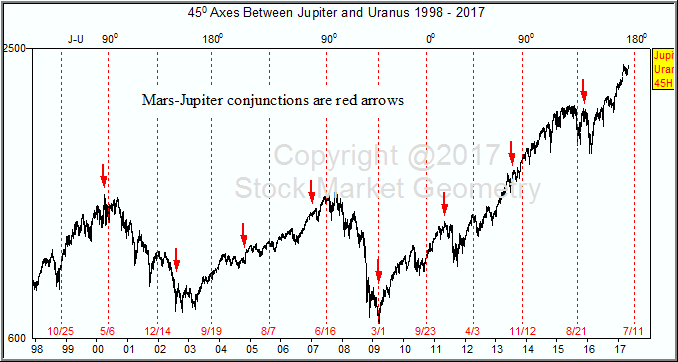
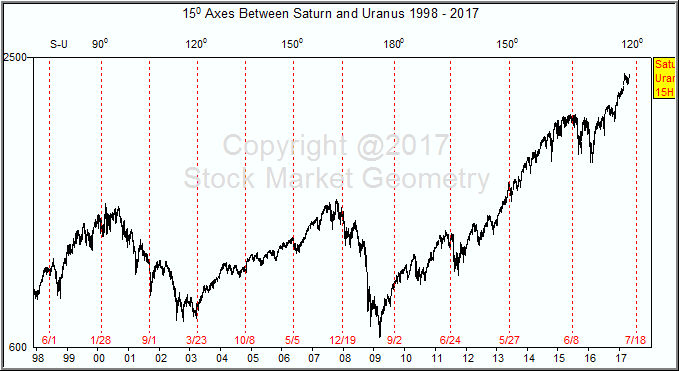
The two simple cycles shown below are (1) Jupiter-Uranus 450
axes with Mars-Jupiter conjunctions included. And (2) Saturn-Uranus
along 150 axes. You can see the biggest turns happened when
they all aligned, such as the 2000, 2009, 2015, etc.
Tick Tock ...
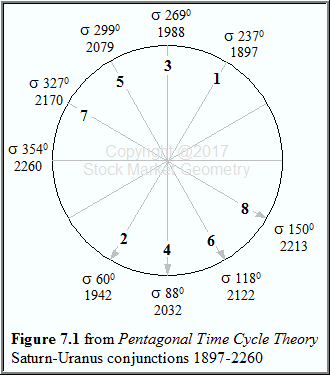 Chapter 7, Wheels Within Wheels, of
Pentagonal Time Cycle Theory showed
how the 45-year Saturn-Uranus cycle rotates around the cosmos like the
hands of a great grandfather clock. Centuries of these conjunctions
flipped back and forth from one side of the sky to the other.
As if they were an art masterpiece, these cosmic cycles are drawn onto
the mass emotions on Earth, and played out in stock market trends.
The 150 axes shown on the above charts
are subdivisions of this 45-year cycle. As these harmonics increase in
size, 30 to 90 to 120, their correlation
with patterns of market symmetry becomes more clear.
One of the biggest subdivisions of the
Saturn-Uranus cycle is
when they are 1200 apart. This alignment arrives again in
July 2017.
 There are many more alignments happening
in July that we will get to later. For now, it's instructive to use CycleTimer
to look back in time at how the Saturn-Uranus 1200 and its
600 subdivision correlate with past market conditions.
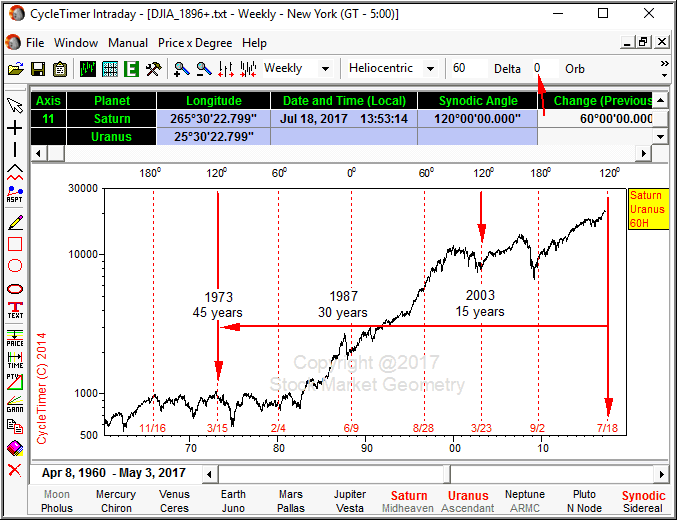
The price scale of the below chart is log and the "orb" is
set to "0", so the angles are exactly 60, 120, 180, etc.
The major 1973
top and 2003 bottom occurred within days of the exact 1200
angle. In fact, this chart shows that every cycle has coincided with a
major market turn, except 1996 when there was a major bull advance
underway.
CycleTimer users can scroll back to the 1800's to
see many additional correlations.
Tick Tock ... 45 Years Back - Top of
1973
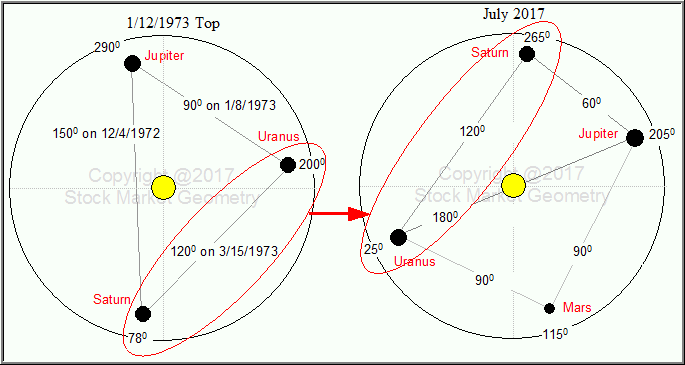
Looking back one complete 45-year Saturn-Uranus
cycle from the approaching 1200 alignment takes us to the
1/12/1973 top. The planetary alignment at that time shows a
fascinating symmetry with 7/2017. Not only are Saturn and Uranus at
the same 1200 aspect, but both Saturn and Uranus have
flipped over 1800 from their 1973 positions. And
Jupiter has moved to the Uranus 1973 location.
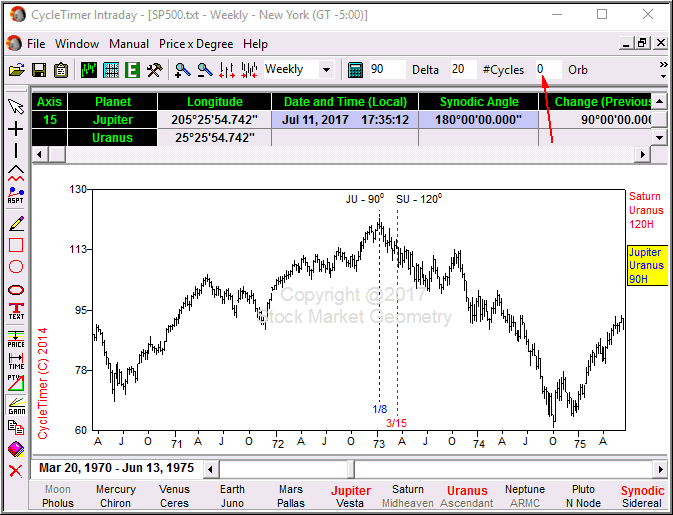
The daily SP500 chart shows how closely these two
major cycles were to the actual top, with the Jupiter-Uranus cycle
missing by just a few days . Note that the "orb" is set to zero so the
calculated angles are exact multiples of 900.
Tick Tock ... 30 Years Back - Crash of
'87
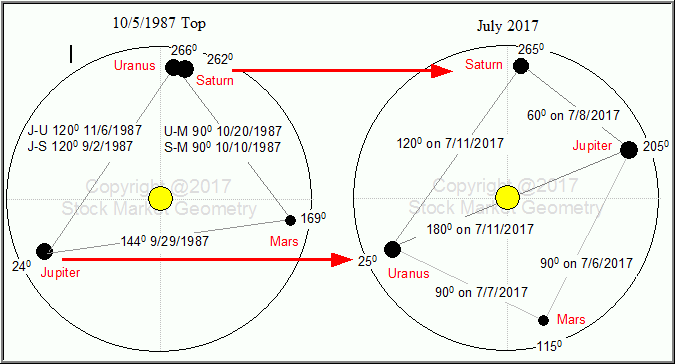
The crash of October 1987 occured
near the Saturn-Uranus conjunction. Thirty years later Saturn will
have returned to the 10/5/1987 location of Saturn and Uranus, which is
also 1800 from the 2002
low, 1800 from the 1973 top, 1800 from the 1914 market closing,
and 3600 from the tops in 1929 and 1899.
CycleTimer users can put 180 in "Delta" and start
in July 2017 to look back at this cycle on a daily chart.
Uranus will have moved 1200
to Jupiter's 10/5/1987 location on this same date in July 2017.
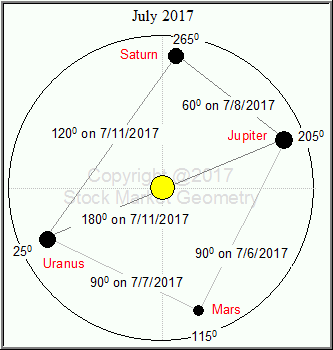
On July 2, 2017 Jupiter will be EXACTLY 1800
from its location during the "Black Monday" crash of 10/19/1987.
Mars will square Uranus on 7/7/2017, as it did on
Black Monday, 10/19/1987, having squared Saturn the week before on
10/10/1987. This time Mars squares Jupiter and Uranus on the same
day, 7/7/2017, and is 1500 from Saturn.
Tick Tock ... 15 Years Back - 2003
Bottom
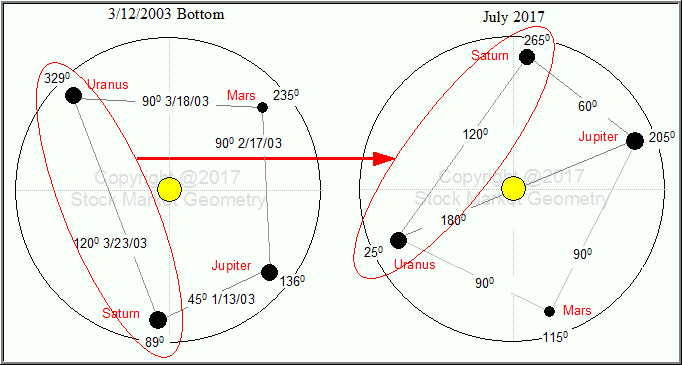
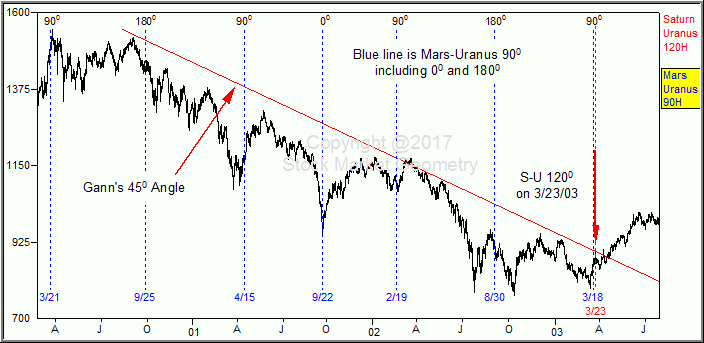
The triple bottom of 2002-2003 was complete when
the Gann 450 angle was broken. Comparing the cosmos during
this time to July 2017 shows that Saturn has flipped over 1800
and Uranus
has moved 600, returning to the 1200
aspect.
Mars
squared Jupiter and Uranus within days of the 2003 bottom, as it does
in July.
Jupiter-Uranus 1800 Cycle
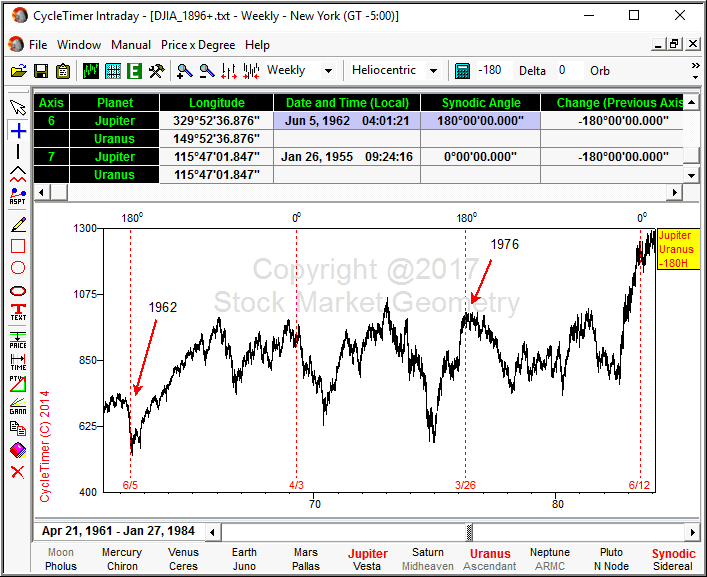
Every 14 years Jupiter and Uranus are in opposition, 1800.
This cycle returns on 7/11/2017, the same day as Saturn-Uranus 1800,
and only 5 days after Mars Squares them both. That is a lot of cycles
aligning within a small time window.
This cycle arrived at the top in 1976 and during the bear market of 1962,
with Mars-Jupiter
squaring at the 1962 top, a few weeks earlier.
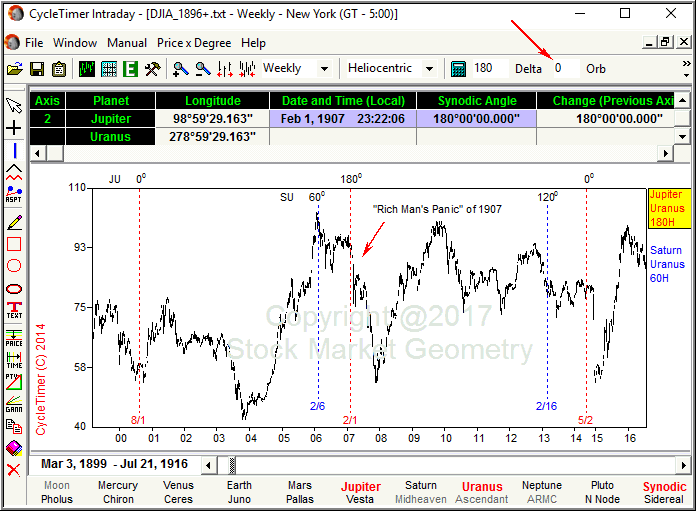
The 1962 bear market was 55 years, or 4 complete Jupiter-Uranus cycles
from 2017. Looking back another 55 years is the "Rich Man's Panic of
1907". Jupiter-Uranus reached 1800 right at the start of
the panic, with Saturn-Uranus 600 defining the actual top a
year earlier.
CycleTimer users should continue this review by charting the daily DJIA
data from 1896 and scrolling in time to see the cycles.
Conclusion
Many large planetary cycles align during the month of July, 2017.
Historically, when this has happened it has caused market trend
disruption. When only two planets have aligned it has caused
volatility. Three aligning at the same time is less common, and
produces a higher probability of forecasting success.
Of course, this must be viewed within the context of the
17-year cycle bottom. And always
keep in mind that the market will do as it wishes, not as we wish. But
at least you are now aware that the red flags have been set.

![]()