stock market geometry
unique cycle analysis
learn how CycleTimer Software Forecast
the 2002, 2009, and 2025 panics to the day!

This brief video shows how deadly accurate Cowan cycles are when used with CycleTimer software. This particular stock market cycle (and others) was used by Cowan to call the market bottom in 2002, the bottom in 2009 on the exact day, and the April 2025 ‘tariff panic’. See Cowan’s ‘blog’ posts for how these predictions evolved real-time.
2002 was accurate to the day and ended the 3-year bear market that Cowan predicted in 1999, nailing both direction and duration years in advance! The 2009 bottom, the 17-year cycle bottom in 2016, and the ‘tariff panic’ of 2025 all aligned beautifully with a cycle Cowan revealed 30 years prior in 1993!
Find more CycleTimer videos and screenshots in ‘Videos’, ‘CycleTimer’, and ‘Blog”.

long-term data
Stocks (1790), Bonds (1727),
Wheat (1259), Corn (1901),
Oats (1901), Cattle (1970),
Soybeans (1913), Australia (1875)
INTRADAY
One-minute data for SP500, GLD, NDX, IWM, NYA, NDX.
cycletimer software
Accurate and fast cycle projections for any market
Calculations that previously took hours or days to do by hand are now done in seconds.
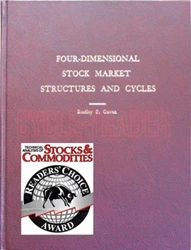
award-winning course
Bradley F. Cowan’s course won the ‘Readers Choice Award’ from Technical Analysis of Stocks and Commodities magazine, ‘Stock Trading Systems’.
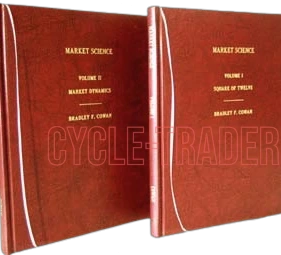
market science
volumes i & ii
Square of Twelve
&
Market Dynamics

pentagonal time
cycle theory
Five-Fold Symmetry in Stock Market Cycles

wd gann master courses
Master Courses in Stocks and Commodities Including Rare Writings of WD Gann
About us
 Stock Market Geometry was founded in the early 1980’s by award-winning author and trader Bradley F. Cowan. The objective is to explore non-conventional technical analysis and cycle techniques for projecting high probability financial market turning points.
Courses, software, and long-term data are provided, teaching some of the techniques discovered and developed by Mr. Cowan. Among the many accolades these courses have received are the ‘Readers Choice Award’ for stock trading systems from Technical Analysis of Stocks and Commodities magazine, and ‘Book of the Year’ from SuperTraders.
 CycleTimer software was developed to do the ‘heavy lifting’ some of the work requires. This frees the analyst to research many cyclic rhythms in a very short period of time to find the one synchronized with his specific market. The above video shows one example of a cycle found by Cowan, that he used to call the March 6, 2009 bottom on the exact day! (see blog)
Long-term data is provided for identifying the larger trend-dominating cycles. Wheat goes back to the 1200’s, Bonds to the 1700’s, and Stocks to 1700’s. Oats, Live Cattle, Soybeans, and Corn are also available.
One-minute data for more than one year is provided for several indices, more than two years for the SP500.
stock market geometry
unique cycle analysis
how CycleTimer Software Forecast the 2002, 2009, and 2025 panics to the day!
This brief video shows how deadly accurate Cowan cycles are when used with CycleTimer software. This particular stock market cycle (and others) was used by Cowan to call the market bottom in 2002, the bottom in 2009 on the exact day, and the most recent ‘tariff panic’. See Cowan’s ‘blog’ posts for how these predictions evolved real-time.
2002 was accurate to the day and ended the 3-year bear market that Cowan predicted in 1999, nailing both direction and duration years in advance! The 2009 bottom, the 17-year cycle bottom in 2016, and the ‘tariff panic’ of 2025 all aligned beautifully with a cycle Cowan revealed 30 years prior in 1993!
More CycleTimer videos and screenshots are available in ‘Videos’, ‘CycleTimer’, and ‘Blog”.
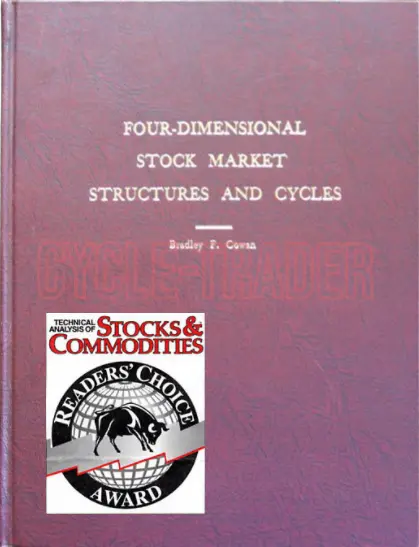
award-winning course
Bradley F. Cowan’s course won ‘Readers Choice Award’ from Technical Analysis of Stocks and Commodities magazine ‘Stock Trading Systems’
readers choice award
Technical Analysis of Stocks and Commodities
‘Stock Trading Systems’
market science
Volumes I & II
Square of Twelve&
Market Dynamics

pentagonal time
cycle theory
Bradley F. Cowan’s book on five-fold symmetry found in stock market cycles

wd gann master courses
Master Courses in Stocks and Commodities
Including
Rare Writing of WD Gann

cycletimer software
Accurate and fast cycle projections for any market.
Cycle calculations that previously took hours or days to do by hand are now done in seconds.

long-term data
Stocks (1790), Bonds (1727),
Wheat (1259), Corn (1901),
Oats (1901), Cattle (1970),
Soybeans (1913), Australia (1875)
INTRADAY
One-minute data for SP500, GLD, NDX, and others
About us
Stock Market Geometry was founded in the early 1980’s by award-winning author and trader Bradley F. Cowan. The objective is to explore non-conventional technical analysis and cycle techniques for projecting financial market turning points.
Courses, software, and long-term data are provided, teaching some of the techniques discovered and developed by Mr. Cowan. Among the many accolades these courses have received are the ‘Readers Choice Award’ for stock trading systems from Technical Analysis of Stocks and Commodities magazine, and ‘Book of the Year’ from SuperTraders.
CycleTimer software was developed to do the ‘heavy lifting’ some of the work requires. This frees the analyst to research many cyclic rhythms in a very short period of time to find the one synchronized with his specific market. The above video shows one example of a cycle found by Cowan, that he used to call the March 6, 2009 bottom on the exact day! (see blog)
Long-term data is provided for identifying the larger trend-dominating cycles. Wheat goes back to the 1200’s, Bonds to the 1700’s, and Stocks to 1700’s. Oats, Live Cattle, Soybeans, and Corn are also available. One-minute data for more than one year is provided for the SP500 and others.