cowan’s forecasting record 2015-2025
All posts were prominently placed on the front page of cycle-trader.com. A few, as indicated, were submitted by students of Mr. Cowan’s techniques.
CycleTimer software was used to show how easily all these calculations are made with no technical training required.
Intraday analysis was also introduced during this time, showing Cowan’s techniques work on any time frame.
3/30/2025
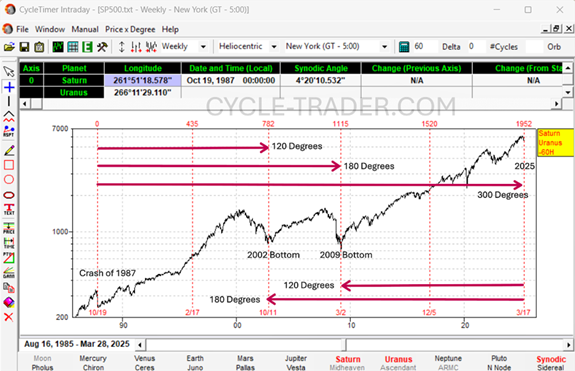
This is an update of the chart Cowan posted at the exact bottom in 3/6/2009. That original post can be seen in the blog record.
Since Cowan published his first book, Four-Dimensional Stock Market Structures and Cycles, in 1993, he has emphasized the synchronicity that exists between stock market cycles and the heliocentric Saturn-Uranus cycle. This cycle has continued to provide accurate market timing for more than 30 years since that publication.
This chart was produced with CycleTimer software showing 60 degree cycles, starting at the October 1987 crash low. The 2002 bottom was accurate to the day! The 2009 bottom accurate to a couple days! This cycle, as well as those described below, explain why the market dropped sharply after the recent February top. Note that these cycles marked bottoms with violent reversals, including the 2016 cycle, which marked the end of the 17-year cycle.
3/12/2025
Traders looking for insight into the recent market decline should study Cowan’s cycle work published in Pentagonal Time Cycle Theory. Specifically, study his 17-year “mid-cycle” panic. 17 years back from 2025 is: 2008, 1991, 1974. Also, his “Beast Cycle” of 12.8 years (17 x 3/4) produces 2012, 2000, 1987, 1974, 1961.
8/2023
Update of Forecast RUT Top- On 3/30/2022 (See Below) we forecast that the Stock Market was “Approaching a High Risk Zone”. This post was the exact top of the market with strong upward momentum.
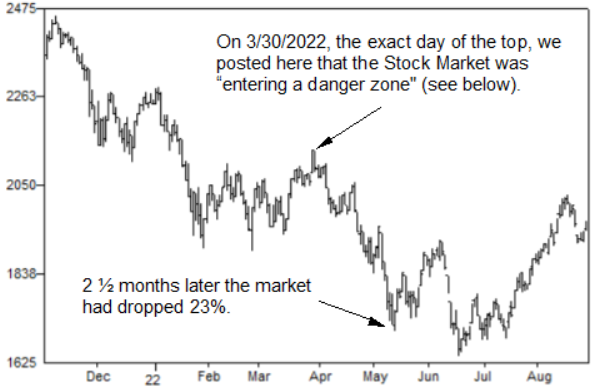
3/30/2022
Approaching High Risk Zone. The 3/12 post showed the New Moon (8-week cycle) in the RUT. This post updates that cycle to the present because the next New Moon arrives very soon.
As the below chart shows, the quarter-cycle (0-90) following the New Moon is some of the most destructive. You can add the quarter-cycle by clicking the “Add a Cycle” icon on the left tool bar and changing the Delta to 90.
CycleTimer settings:
Geocentric
Delta = 360
Orb = 0
Synodic – Moon and Sun

3/12/2022
The 2/8/2022 post showed the New Moon in the SP500 covering a 6 month period. We now expand that to one year in the Russell 2000. This index is good to demonstrate lunar cycles due to its sideways choppy action. An index showing a strong directional trend (such as the SP500) will overwhelm the smaller cycles.
These cycles occasionally invert top-to-top (note 3/13/2021). This happens due to cycle alignment at the equinox (a topic for another day).
CycleTimer settings:
Geocentric
Delta = 360
Orb = 0
Synodic – Moon and Sun
3/12/2022 (Continued)
We now add a second cycle to our chart. The only change to make is Delta=180. This will plot all New and Full Moons. Very few of these arrived uneventfully. And if given a tolerance of +/- one day, every cycle aligned with a tradable turn.
CycleTimer settings:
Geocentric
Delta = 180
Orb = 0
Synodic – Moon and Sun
2/12/2022
Using CycleTimer to Time SPY Intraday
The 2/8 post used the New Moon (Sun-Moon conjunction) to time the SPX on daily charts. The Moon is also used for intraday timing. This chart shows 5 days of the SPY last week using 5 minute bars. Because the Earth rotates one degree in about 4 minutes you can use 4 minutes bars for more precision.
CycleTimer Settings:
Topocentric, New York
Delta=60
#Cycles=1
Synodic – Moon and Midheaven
Each of the cycle starting points is a strong natural angle, either 90 or 120 degrees apart. 60 degrees of Earth rotation (relative to the Moon) from this starting point was another turn. Last week they were all tradable tops.
2/8/2022
Using CycleTimer to Find the New Moon Trigger Points
On 2/25/2015 we posted the time cycle in the RUT that turns on the first of the month. This cycle is further refined by using the New Moon. CycleTimer calculates all cycles to within 1/1000 arc second, which is helpful for intraday charts and Topocentric settings.
CycleTimer settings for cycle:
Geocentric
Delta = 360
Orb = 0
Synodic – Moon and Sun

3/21/2020
Based on page 55 of Cowan’s Pentagonal Time Cycle Theory. Cowan showed that Saturn-Uranus cycles repeat in the same zodiacal locations (plus one 30 degree sign) every 90 years. These first order recurrences marked the 1929 and 2020 tops. Saturn-Uranus cycles repeat on the opposite side of the zodiac every 45 years. These second order recurrences, same angle opposite zodiac location, marked the 1975 bottom.
3/21/2020 (Continued)
The 1930’s depression was worsened by misguided government fiscal policies. The 2020’s version of destructive government intervention is forced closures of thousand of businesses for “safe space”. Many of these businesses will never recover.
The Geocentric perspective below shows Saturn-Uranus approaching the ominous 90 degree angles at the 1929-1930 and 2020 tops. This chart measures Saturn-Uranus delta 90 from the 2020 top. This includes conjunctions and oppositions. Every recurrence for the past 100 years was significant, and lasted much longer than expected.
2/29/2020
The most recent plunge in stocks has coincided perfectly with Cowan’s cycles, as published in his books and articles. The below chart uses CycleTimer software to calculate the 15 degree Jupiter-Uranus cycle measured from the 12/25/2018 low. It coincided perfectly with the August 1, 2019 and February 2020 drops.

2/3/2018
On 9/2017 (see below) Dawa Raju of India submitted his Elliott Wave analysis of the SP500 using CycleTimer software. In this chart he updates that analysis to present. His original analysis showed potential resistance when Wave 5 = Wave 1. His current chart shows that the most recent top occurred when Wave 5 = Wave 3.
2/3/2018 (Continued)
The broad based NYA shows:
Wave 5 = Wave 3 = Wave 1
Wave 2 = Wave 4 = 50% correction of preceding wave.
9/23/2017
This chart was submitted by Dawa Raju of India. He is a long time student of Gann and Cowan. It is his analysis of the Elliott Wave and Fibonacci structure of the SP500 using CycleTimer software.
5/20/2017
Shortly after the November, 2016 bottom we posted that a major bull advance was under way. Six months later the market has rocketed higher than anyone expected (except Stock Market Geometry).
12/11/2016
An ongoing theme of Cowan’s books is that the stock market is built of geometric structures. The sides of which align with 17-year cycles. Cowan showed these structures extensively in his first books Four-Dimensional Stock Market Structures and Cycles. In 2009 he published his final book Pentagonal Time Cycle Theory where he forecast late 2016 as the beginning date of the new 17-year cycle. He made this forecast 7 years before the fact.
Now that 2016 is coming to a close and the market has been rocketing higher, it’s reasonable to ask if the huge 17-year cycle that started in 2000 has turned into a new cycle.
Readers of Cowan’s books are familiar with the below chart showing the 17-year down cycle in the DJIA 1966-1982. Overlaid on this chart is the most recent cycle in the NYA.
One of the first things that stands out on this chart is how the NYA continued to make higher bottoms after 2009. The question is how can a major 17-year cycle bottom after a 7-year series of higher bottoms. A review of past 17-year cycles shows that this is actually the most common way the cycle bottoms. In almost every case the mid-cycle panic bottoms (such as the 1907, 1942, 1974 and 2009 bottoms) marked the low price for the entire cycle.
12/11/2016 (Continued)
The this chart overlays the final 7 years of the 1966-1982 cycle with the most recent 7 years in the NYA. Notice how both charts continued to make higher bottoms off the mid-cycle panic low. The number of calendar days in the 1974-1982 cycle exactly matches the interval from 2009 to the most recent bottom. Traders expecting a major panic sell-off into the 17-year cycle bottom have not reviewed how previous cycles bottomed.
The conclusion is that the stock market may now be entering a major 17-year bull cycle, the magnitude of which will surprise many traders.
Superimposed on this 17-year bull cycle is another phenomenon Cowan wrote about, the “Periodicity of American War”. Since the Revolutionary War in 1776 American has experienced a “major” war every 84 years:
1776 + 84 = 1860 (Civil War)
1860 + 84 = 1944 (World War II)
1944 + 84 = 2028 (?)
1/18/2016
Bradley F. Cowan published Pentagonal Time Cycle Theory in 2009 where he forecast late 2016 as a major stock market bottom. His based this forecast on the pentagonal subdivision of the 84-year cycle into five smaller 17-year cycles.
EXAMPLES OF GANN’S PRICExDEGREE
1/18/2016
This chart updates the lunar cycle and Price by Degree posted last year. The most recent top coincided perfectly with prices arriving at the intersection of these 2 lines.

9/10/2015
In May we began posting (see below) several charts warning that the Russell 2000 was up against Gann’s Price x Degree. In July prices backed away from that resistance line for the last time and collapsed.
9/10/2015 (Continued)
This chart shows the same Gann Price x Degree in the SP500. Prices rallied back up this resistance line at the 50% retracement. Also shown on this chart is a proprietary lunar cycle that coincides with market tops.

6/9/2015
One month ago we posted a chart of the Russell 2000 with Gann’s Price by Degree. Since then, prices advanced back up to exactly touch that line and retreated. (Since 6/9 prices have again bounced off the Price x Degree).
5/9/2015
The efficacy of Gann’s “Price by Degree” in timing the SP500 has been well documented over the past year in the below posts. This same tool also timed the 4/27/2015 top in the Russell 2000. Since October 2014 the Russell had been following a linear trend until running into the Price x Degree. This top also coincided with the cycle shown below in the 2/25 post.
2/25/2015
Sometimes a simple static cycle is all you need. This chart shows a 2-month top-to-top cycle in the RUT for the past year. The start of every other month has seen selling.
1/8/2015
This chart updates the two Gann lines previously shown in the SP500. Key areas since the last post are circled. A picture is worth 1000 words!